


The latest car sales figures from Vfacts show a distinct dip in sales for April compared with the same time in 2023.
Just 6.4 per cent of the entire auto market were pure battery electric vehicles (BEVs) according to the latest figures from Vfacts, down from 7.9 per cent in the same month for 2023.
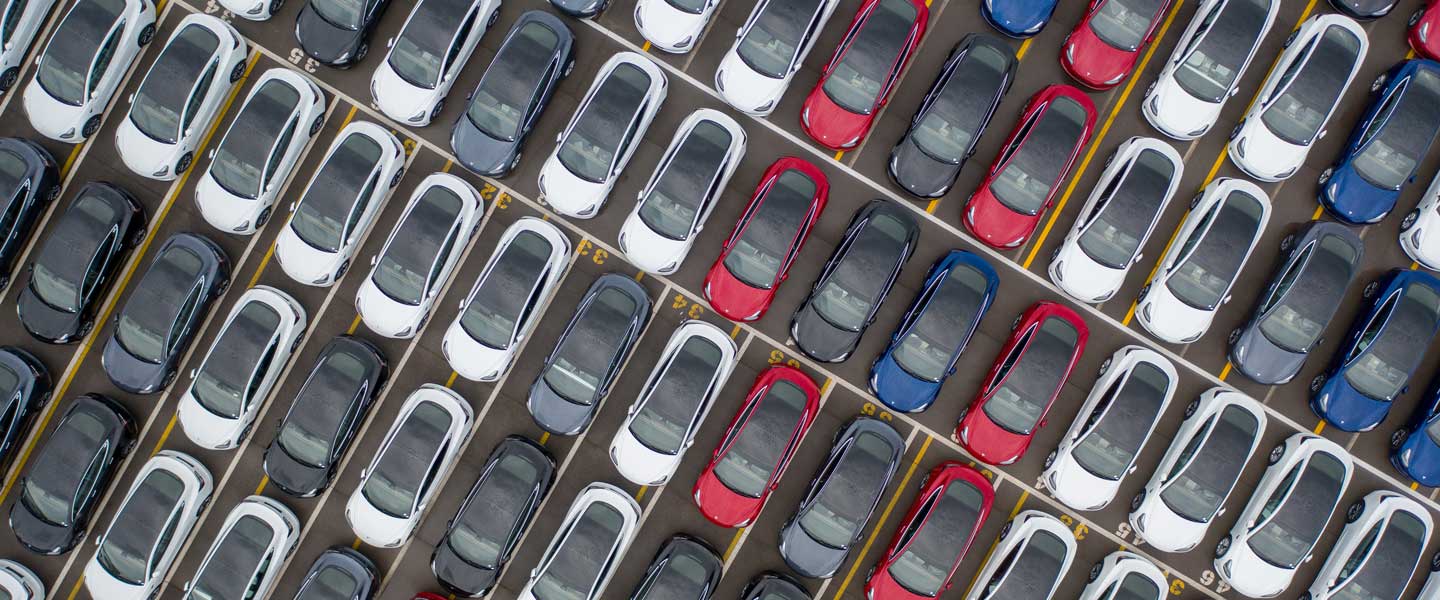
In total, 6194 BEVs were sold out of 97,202 new car sales, which was slightly down from 6530 BEV sales the year before against 81,065 for the broader market.
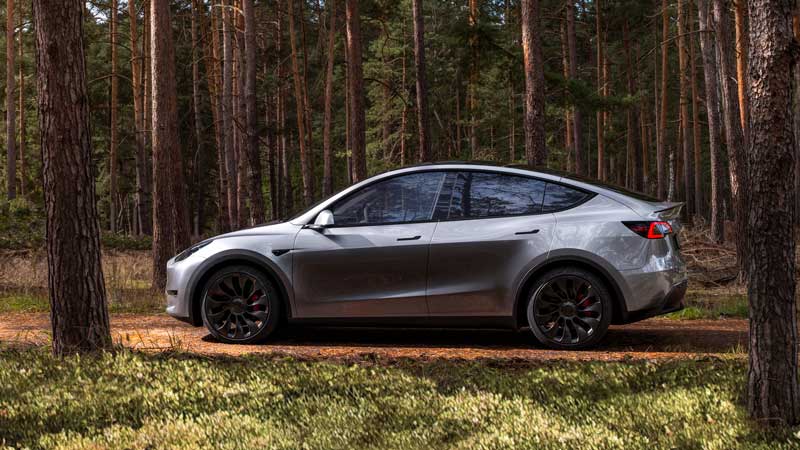
In April, Tesla delivered 1116 Model Ys (which now start at $60,900 before on-roads after significant price drops in April) and 911 Model 3s (now starting at $58,900 before on-roads.) This saw its monthly sales figures down by two-thirds, which affected overall EV sales significantly.
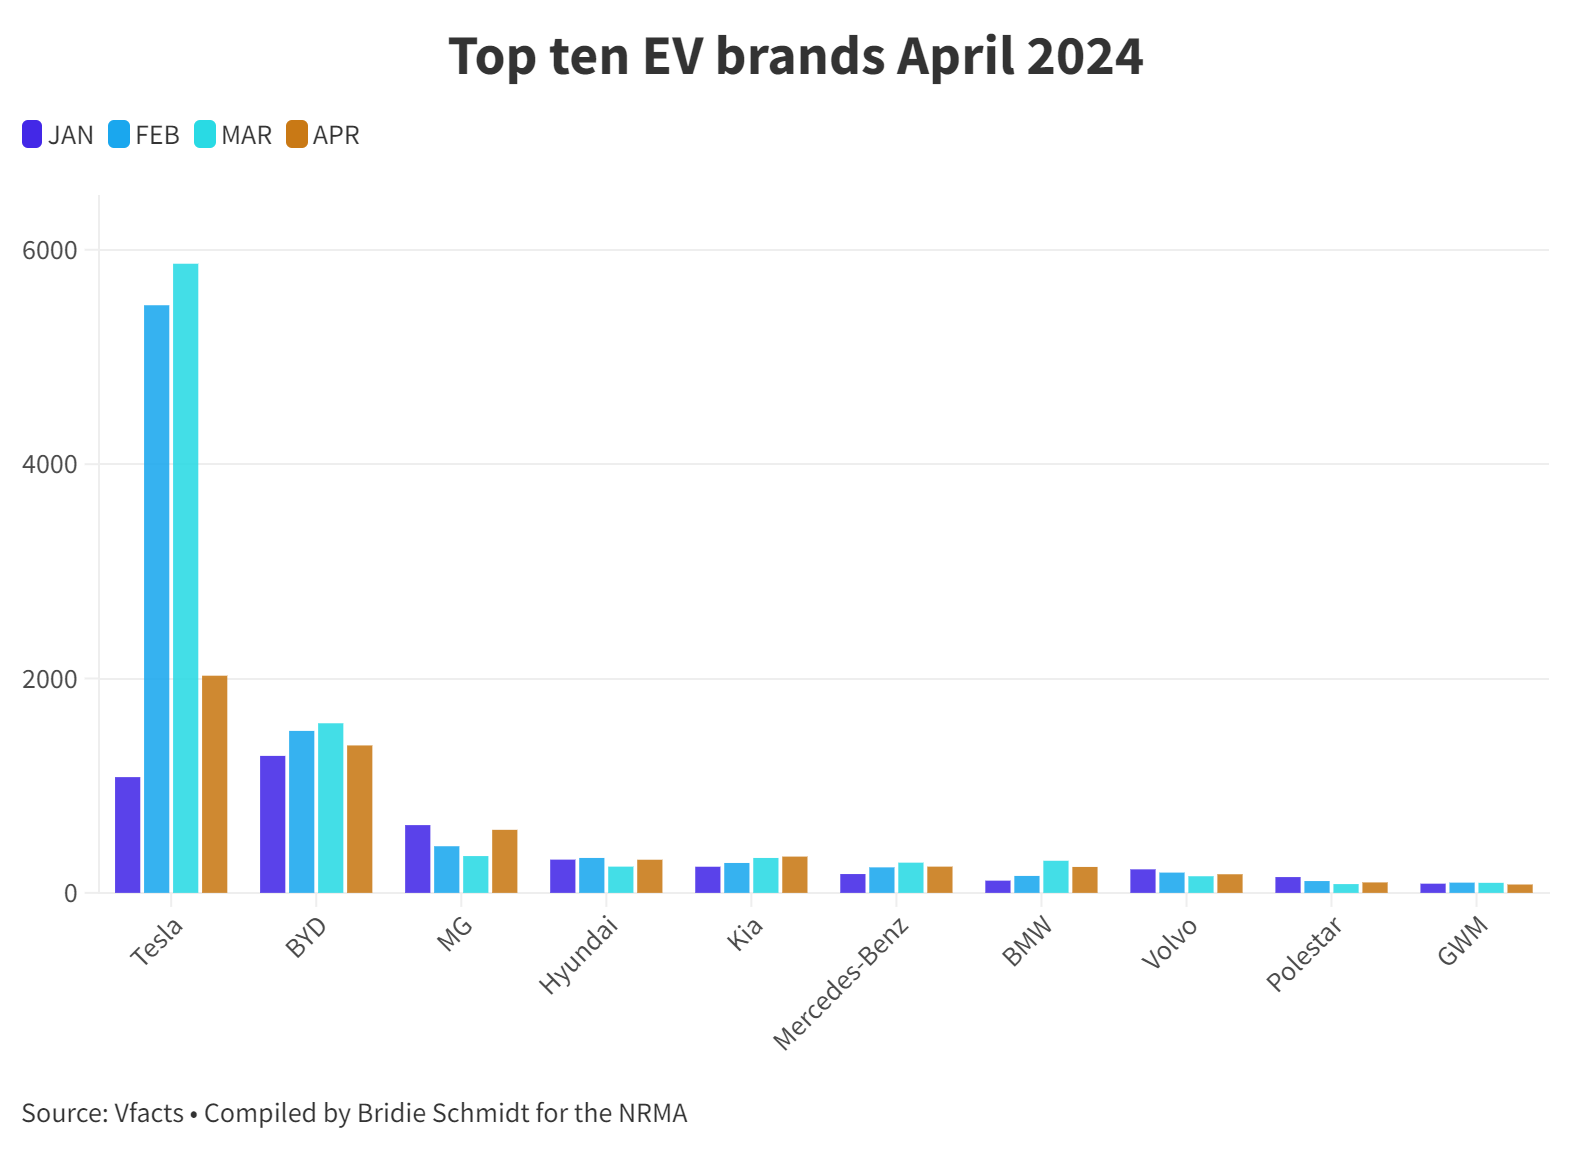
This also saw Tesla’s stranglehold on the EV market somewhat loosened. Whereas Tesla accounted for 53 per cent of the EV market in 2023, in April just 33 per cent of EVs delivered to customers were of the Tesla variety.
The BYD Seal, which starts at just below $50,000 before on-roads, held the number three spot with 811 sales. This was followed by the MG MG4 – now on sale from $39,990 driveaway – with 476 sales. At number five is the BYD Atto 3, which starts at $48,011 before on-roads, with 418 sales.
The BMW i4 – which starts at $85,900 before on-roads - is proving popular as far as premium models go with 206 sales. Sales of the BYD Dolphin, priced from $38,890 before on-roads, are slowing down slightly, while the all-electric Hyundai Kona, Volvo XC40 and Kia EV remain steady favourites at eight, nine and ten.
In April, the Volvo EX30 was introduced, with 115 hitting the road. Four out of ten cars sold by Volvo were pure electric vehicles, as the European carmaker seeks to sell only BEVs in Australia from 2026.
Looking at segments, BEVs accounted for 16 per cent of passenger vehicles (which includes hatchbacks and sedans), while six percent of SUVs sold were electric.
|
Model |
JAN |
FEB |
MAR |
APR |
Total |
|
Tesla Model Y |
384 |
2027 |
4379 |
1,166 |
7956 |
|
Tesla Model 3 |
723 |
3593 |
1638 |
911 |
6865 |
|
BYD Seal |
589 |
619 |
365 |
811 |
2384 |
|
MG MG4 |
537 |
446 |
352 |
476 |
1811 |
|
BYD Atto 3 |
465 |
711 |
1044 |
418 |
2638 |
|
BMW i4 |
93 |
128 |
236 |
206 |
663 |
|
BYD Dolphin |
256 |
219 |
213 |
181 |
869 |
|
Hyundai Kona Electric |
186 |
176 |
140 |
127 |
629 |
|
Volvo XC40 recharge |
166 |
143 |
135 |
140 |
584 |
|
Kia EV6 |
199 |
192 |
198 |
132 |
721 |
Globally, the broader BEV market is battling headwinds including high interest rates, which of course leaves less in the packet for things like new cars. But in contrast to reports that BEV sales are slowing down, looking at total EV sales in Australia since the start of the year there has been an increase.
Year-to-date, there have been 31,662 BEVs sold in Australia for the first four months of 2024 compared to 23,926 the same time last year. Of course, there has also been an increase in car sales across the board, bringing the total percentage down.
Both the Tesla Model Y and Model 3 are heading up the year-to-date sales at number one and number two. The BYD Atto 3 and BYD Seal are following up at number three and four, with MG MG4 and BYD Dolphin coming in at numbers five and six.

The top ten brands overall were (no surprise) Tesla, followed by BYD and MG, then Hyundai, Kia, Mercedes-Benz, BMW, Volvo, Polestar and GWM.
The ACT is still by far the leader in EV uptake in Australia, sitting at 17.2 percent for April and 20.2 percent for the year-to-date.
Unsurprisingly numbers were down across the board in all states. While NSW leads the way, in terms of volume, it also saw the largest drop in sales – almost half the number of EVs were delivered to drivers in April compared to the month prior.
Additionally, this drop saw South Australia overtake NSW in terms of EV market share in April, as the southern state saw EVs make up 6.8 per cent of new car sales.
|
Jan |
Feb |
Mar |
Apr |
April market share |
YTD market share |
|
|
ACT |
188 |
453 |
336 |
248 |
17.2% |
20.2% |
|
NSW |
1492 |
3566 |
3728 |
1727 |
5.9% |
8.6% |
|
NT |
18 |
25 |
31 |
35 |
4.1% |
3.2% |
|
QLD |
1302 |
1894 |
2169 |
1338 |
6.4% |
7.7% |
|
SA |
247 |
506 |
623 |
463 |
6.8% |
7.0% |
|
TAS |
97 |
123 |
115 |
99 |
5.9% |
6.6% |
|
VIC |
1057 |
2311 |
2817 |
1709 |
6.5% |
7.3% |
|
WA |
492 |
1233 |
645 |
575 |
5.9% |
7.0% |